Bayanبيان
Data you can read.
Reports you can hand over.An analytics view with traceable figures, and an Arabic report that stays clear when printed or shared as a PDF.
The brief
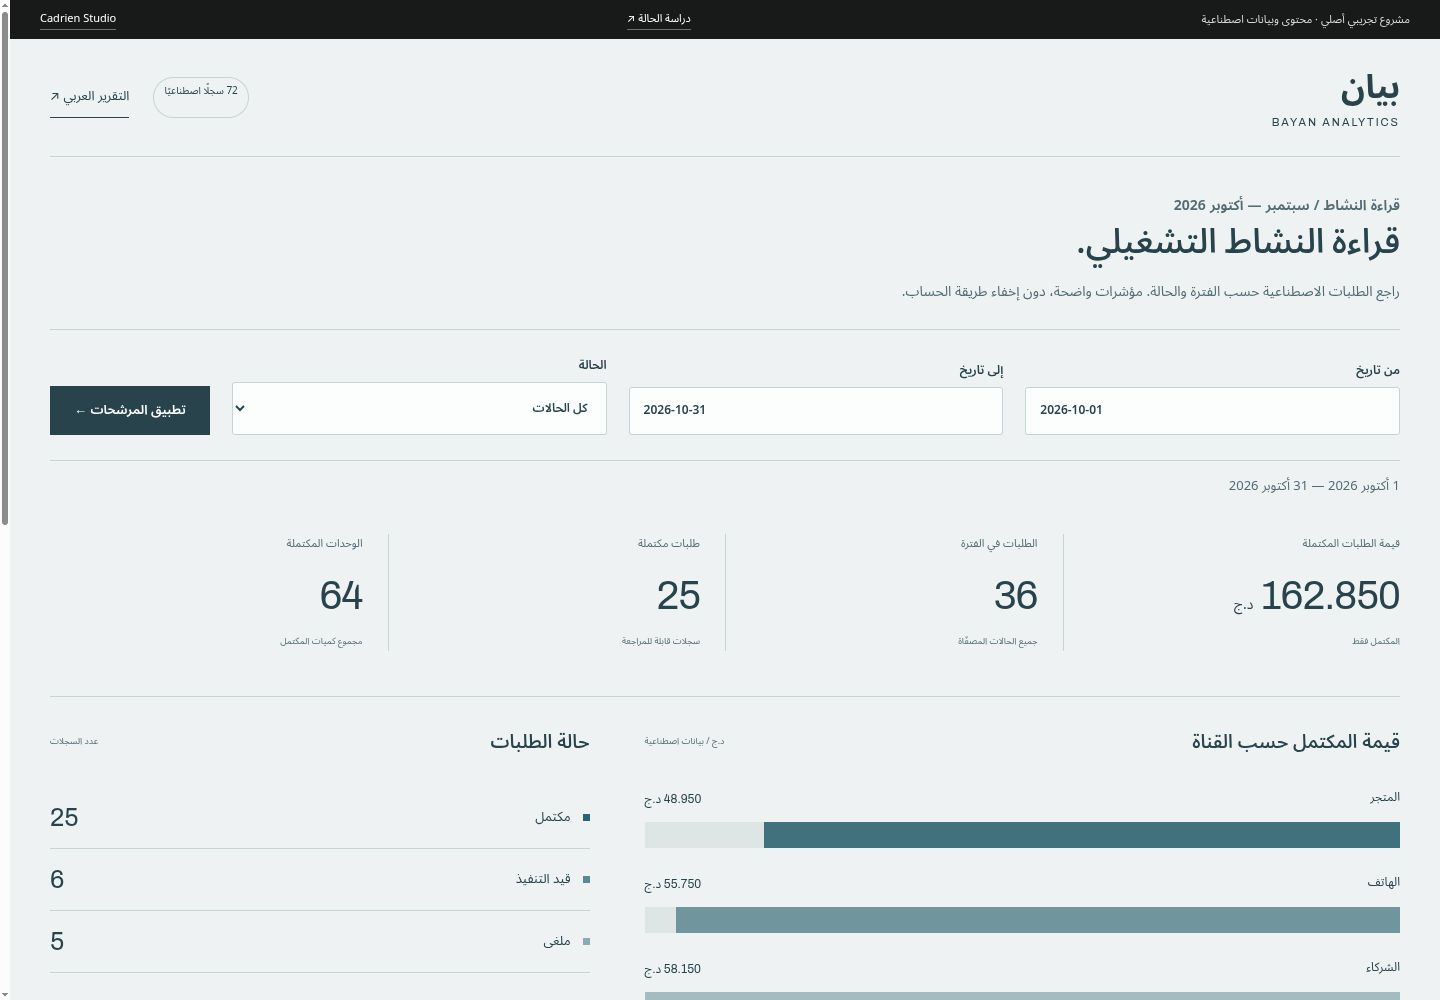
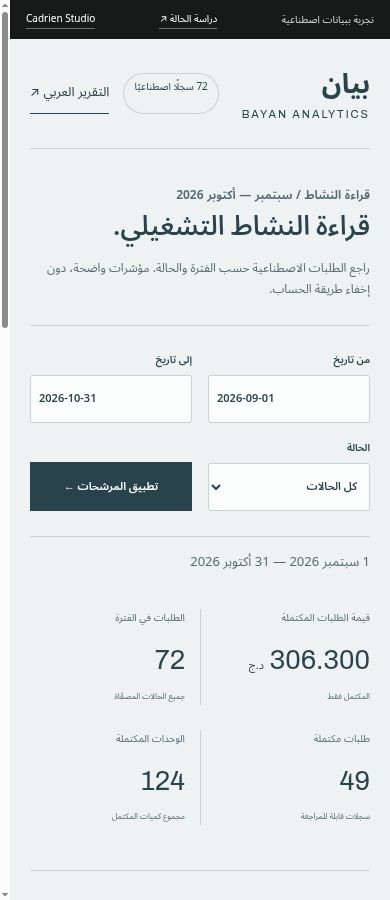
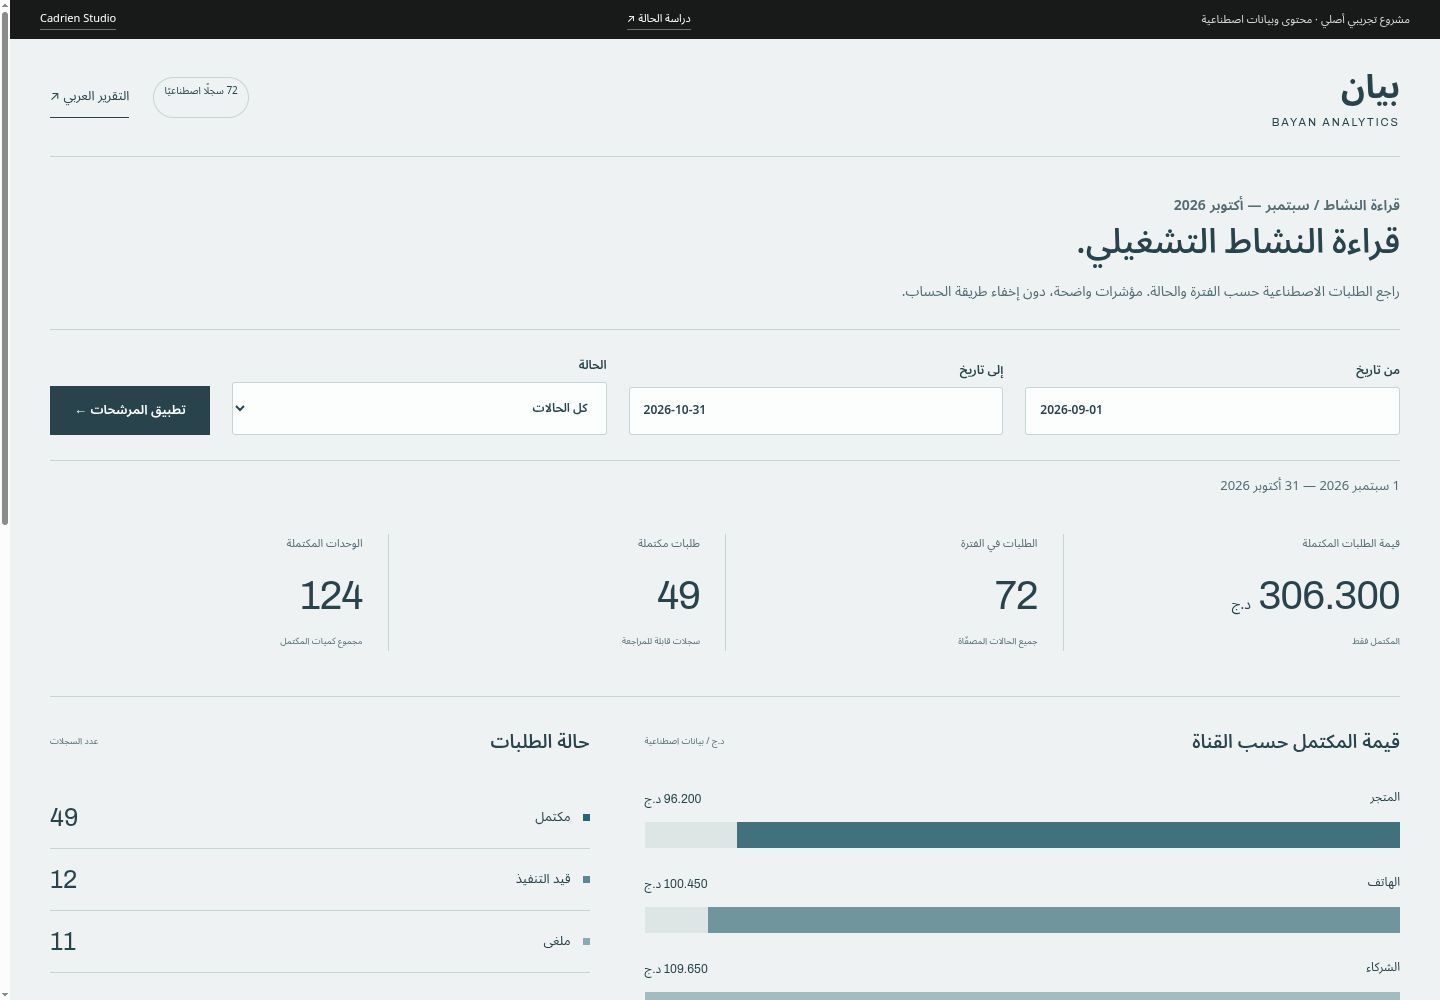
Reviewing activity needs figures that respond to filters, and an Arabic report that remains clear when printed and shared.
The approach
A fixed synthetic dataset, calculations you can trace and simple charts that carry meaning. The report shows the same filtered rows, with a clear definition of what each indicator counts.
What you can verify
- Set the period and order status; the figures recalculate.
- Compare channels and inspect the rows behind each total.
- Generate the Arabic report, then print it or download it as a PDF.
- Completed-order value counts completed orders only, and the page says so.
- Tests check the aggregations and the actual bytes of the generated PDF.
Implementation & handoff
An analysis interface, seeded data, independent calculations and tests, an Arabic report template and a PDF. A real four-page sample generated by the project is downloadable on this page. PDF generation runs locally and needs Python 3 and LibreOffice.
Honest context
72 synthetic records — not a real company’s performance. The revenue shown is the total value of completed orders only; there are no forecasts and no financial advice.